Campus Plans (pdf)
Campus Plans are available for institutions as PDFs back to 2012
Select any filter and click on Apply to see results
Success Strategies by Category
Success Strategies by Category
Success Strategies by Category are available from 2023
Abraham Baldwin Agricultural College-2023-Implementation with Data Collection, Analysis, and Management (Data CAM): Career Data
Update Year:
2023
Learning Communities (University College) (Albany State University-2023)
Update Year:
2023
Pages
South Georgia State College
South Georgia State College is a four-year residential institution that serves the educational, social, and economic development of the region by providing accessible, high quality student-centered education. Through close collaboration with faculty and staff, students are engaged in educational opportunities that empower them for success in a sustainable global society. South Georgia State College prepares students to think critically, communicate proficiently, and act responsibly as civic-minded, environmentally conscious citizens.
South Georgia State College Institutional Profile
South Georgia State College Campus Plan Update 2015
Institutional Mission and Student Body Profile
The mission statement of South Georgia State College (SGSC), approved by the Board of Regents for the institutional consolidation of former South Georgia College and former Waycross College on May 8, 2012, is as follows:
South Georgia State College, a state college of the University System of Georgia, is a multi-campus, student-centered institution offering high-quality associate and select baccalaureate degree programs. The institution provides innovative teaching and learning experiences, a rich array of student activities and athletic programs, access to unique ecological sites, and residential options to create a diverse, globally-focused, and supportive learning environment.
Since SGSC offers three associate degree programs (AA, AS, and AS in Nursing) and two bachelor’s degree programs (BS in Nursing and BS in Biological Sciences) and no certificate programs, the college’s completion priorities focus primarily on attainment of the associate’s degree—but also on attainment of a limited number of bachelor’s degrees. The Bachelor of Science in Nursing (the first of the bachelor’s degrees) graduated 96% of its first student cohort within three years and 83% of its second cohort within two years. The BS in Biological Sciences has not been in existence long enough to produce its first graduates.
SGSC’s mission, completion priorities, and student body demographics are clearly linked. For instance, an institution consistently enrolling 75-80% “traditional” students best serves its students and promotes retention and graduation with a wide variety of student activities, athletic programs, and student-support services while emphasizing quality teaching and learning experiences. Such an institution also attracts and retains traditional students through the availability of modern residence and dining halls, as well as through focusing on support and intervention strategies for residential students. In addition, a variety of student-support services is extremely important at SGSC, where for the past three years more than half of all students have been Pell grant recipients and approximately 30% have been first-generation college students.
The “Enrollment and Demographic Trends” table below provides a good look at the SGSC student body’s characteristics. In addition to the data in the table, it is noteworthy that in the fall of 2015 SGSC enrolled students from 111 of the 159 Georgia counties, from 22 other states, from 13 other countries, and from 386 high schools. These enrollment figures help “to create a diverse, globally-focused learning environment” (SGSC mission statement). In the table that follows all data prior to fall 2013 has been combined due to consolidation of former South Georgia College and former Waycross College.
South Georgia State College Enrollment and Demographic Trends
|
Total Enrollment |
Fall 2011 |
Fall 2012 |
Fall 2013 |
Fall 2014 |
Fall 2015 |
|
3234 |
3059 |
2579 |
2611 |
2648 |
|
|
Enrollment Status |
|||||
|
Full-Time |
2209 |
2141 |
1877 |
1778 |
1828 |
|
Part-Time |
1025 |
918 |
702 |
833 |
820 |
|
Gender |
|||||
|
Female |
2008 |
1916 |
1584 |
1686 |
1678 |
|
Male |
1226 |
1143 |
995 |
925 |
970 |
|
Underserved |
|||||
|
% Pell Recipient |
65.18% |
63.48% |
63.67% |
59.25% |
55.02% |
|
% First Generation |
33.83% |
33.08% |
34.32% |
29.80% |
26.66% |
|
% Adult Learner |
22.26% |
20.04% |
18.61% |
17.20% |
14.88% |
|
Race/Ethnicity |
|||||
|
Hispanic |
95 |
103 |
103 |
123 |
170 |
|
American Indian, Alaskan Native, Pacific Islander, or Asian |
47 |
40 |
33 |
40 |
36 |
|
Black or African American |
1165 |
1088 |
839 |
834 |
832 |
|
White |
1769 |
1682 |
1585 |
1581 |
1556 |
|
Two or More Races |
22 |
30 |
19 |
26 |
31 |
|
Race Unknown |
136 |
116 |
0 |
7 |
23 |
Source: USG Semester Enrollment Reports (fall 2010-13)/USG ADM Census
Note: All data prior to Fall 2013 has been combined due to institutional consolidation.
Summary of Completion Goals and High-Impact Strategies
Completion Goals
Through its college completion plan SGSC is actively pursuing six of the USG completion goals through the strategies to be discussed below. The six completion goals are as follows:
- Increase the number of undergraduate degrees awarded by USG institutions.
- Increase the number of degrees that are earned “on-time.”
- Decrease excess credits earned on the path to getting a degree.
- Provide intrusive advising to keep students on track to graduate.
- Shorten time to degree completion through programs that allow students to earn college credit while still in high school.
- Increase the likelihood of degree completion by transforming the way that remediation is accomplished.
Strategies
|
Strategy #1 |
Quantway remedial mathematics |
||||||||||||||||||||||||||||||||||||
|
Goal |
Transform remediation to increase likelihood of degree attainment; increase the number of undergraduate degrees awarded. |
||||||||||||||||||||||||||||||||||||
|
High-Impact Strategy |
The vast majority of SGSC remedial students require only remedial mathematics. Consequently, this strategy is quite significant. The Carnegie Foundation for the Advancement of Teaching’s Quantway remedial mathematics strategy is in its 5th year of implementation at SGSC and its 5th year of funding and professional development support from Carnegie. The Quantway course (formerly MLCS 0099, “Mathematical Literacy for College Students”; as of fall 2015 MATH 0987, “Foundation for Quantitative Reasoning”) affords non-STEM (Science/Technology/Engineering/Mathematics)) students the opportunity to complete a remedial mathematics requirement, no matter at what level of initial placement, in one semester. The successful student is then eligible to enroll in the credit-level MATH 1001 Quantitative Skills course. The Quantway course is comprised of modules developed by a network of colleges nationwide working with Carnegie staff. The modules use “real-life” situational mathematical problems, significant student participation both individually and in groups, and instructor guidance to help students build a solid foundation of mathematical literacy and critical thinking skills. Additionally, the Carnegie Foundation for the Advancement of Teaching awarded SGSC a grant last year, one of only five grants awarded nationally, to develop a bridge course that will allow a student who has passed the Quantway course to go directly to college algebra (MATH 1111), rather than pursue the Quantitative Skills (MATH 1001) route. SGSC was informed in June 2015 that the grant has been extended for another year. SGSC is the only college in the nation developing the bridge course from Quantway to college algebra; the other four institutions are developing bridge courses from a remedial statistics course (Statway) to college algebra. |
||||||||||||||||||||||||||||||||||||
|
Summary of Activities |
This strategy is fully implemented. Activities include faculty development, development of courses in collaboration with the Carnegie Foundation for the Advancement of Teaching, collaboration with other institutions nationwide, and the piloting of a bridge and co-requisite remedial mathematics course. Activity highlights include the following: The SGSC Quantway team has been active in professional development in collaboration with the Carnegie Foundation for the Advancement of Teaching. The team is comprised of mathematics faculty members, a campus Quantway administrator, and a campus Quantway institutional researcher. All SGSC team members attend training sessions in California and continue to attend annual Carnegie Pathways forums, the most recent of which was this year (2015). At Carnegie’s request, one of the SGSC mathematics instructors works with Carnegie apart from the regular meetings and forums to assist in developing processes, procedures, and teaching materials and pedagogy. The Quantway course has been offered on the Douglas Campus each semester for over five years. The course was offered at the Waycross Campus for the first time spring 2015. Bridge course/co-requisite course lessons were piloted summer 2015 on the Douglas Campus. The bridge course from Quantway to college algebra, “Support for College Algebra” (MATH 0999) will be fully implemented on both the Douglas and Waycross Campuses fall 2015. The bridge course is the co-requisite course for college algebra (MATH 1111). The bridge course will enable a student who has passed the Quantway remedial mathematics course to go directly into the “Support for College Algebra” co-requisite course and the college algebra course (MATH 1111) at the same time. Beginning fall semester 2015 the Quantway course will be renumbered and renamed to be more in keeping with the USG’s new Learning Support policies. The new nomenclature is MATH 0987, “Foundation for Quantitative Reasoning.” |
||||||||||||||||||||||||||||||||||||
|
Interim Measures of Progress |
The success rate in the Quantway course has shown steady improvement since the baseline semester of fall 2012. “Success” is defined as earning a grade of C (70%) or better. At the end of fall semester 2012 the success rate for the Quantway course (MLCS 0099) was 29.5%. For fall 2013 the success rate increased to 64%. At the conclusion of fall 2014 the success rate had climbed to 70%, while the rate for the “traditional” remedial math course (MATH 0099) was 36%. SGSC’s goal is to maintain at least the 70% success rate for each fall semester’s student cohort and to encourage more non-STEM students to enroll in the Quantway course. The table below records course success rates for MLCS 0099 and MATH 0099 for each fall semester from 2012 through 2014.
Source: SGSC Banner, Fall 2012-Spring 2015 Note: Success is defined as earning a grade of S and unsuccessful is defined as earning a grade of F, W, I, IP, or U. |
||||||||||||||||||||||||||||||||||||
|
Measures of Success |
1. The MLCS 0099 (MATH 0987) course success rate. Baseline is fall 2012 rate of 29.51%. See table above. 2. The MATH 0099 course success rate (for comparison). See table above. 3. The MATH 1001 course success rate of students who came to that course after passing MLCS 0099. Baseline is fall 2012 rate of 37.50%. The success rate for fall 2013 jumped to 66.67%. There has not been sufficient time for fall 2014 students to have more than one attempt at passing MATH 1001; therefore, no data for fall 2014 is reported. 4. The number of attempts it takes MLCS 0099 students to pass that course and exit Learning Support. Due to USG restructuring of Learning Support, SGSC will establish a baseline and begin tracking data fall 2015. 5. The number of attempts it takes MATH 0099 students to pass that course and exit Learning Support (for comparison). Due to USG restructuring of Learning Support, SGSC will establish a baseline and begin tracking data fall 2015. |
||||||||||||||||||||||||||||||||||||
|
Strategy #2 |
Increase Move on When Ready (formerly Dual Enrollment or ACCEL) Offerings on Area High School Campuses |
||||||||||||||||||||||||||||||||||||||||||||||||||||||||||||||||||||||||||||||||||||||||||||||||
|
Goal |
Shorten time to degree completion through programs allowing students to earn college credit while still in high school. |
||||||||||||||||||||||||||||||||||||||||||||||||||||||||||||||||||||||||||||||||||||||||||||||||
|
High-Impact Strategy |
The strategy is to increase Move on When Ready offerings on area high school and SGSC campuses in order to help those students graduate in as little time as possible and to develop a relationship with high schools that will positively affect overall enrollment. |
||||||||||||||||||||||||||||||||||||||||||||||||||||||||||||||||||||||||||||||||||||||||||||||||
|
Summary of Activities |
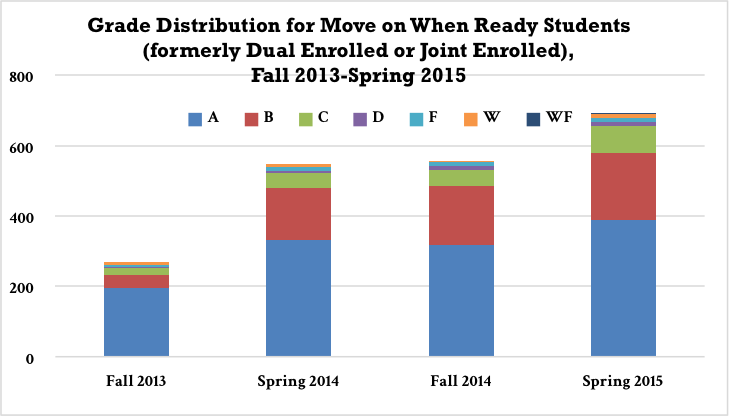
The 2013-2014 goal of increasing the number of high school students enrolled at SGSC by 25% from a baseline of 95 students in fall 2013 has been far exceeded through the efforts of SGSC Enrollment Services personnel and others in communication with area high schools. In addition, SGSC has been tracking grade distribution and course success rates (grade of “C” or better) of Move on When Ready students to monitor any need for intervention strategies. |
||||||||||||||||||||||||||||||||||||||||||||||||||||||||||||||||||||||||||||||||||||||||||||||||
|
Interim Measures of Progress |
Source: USG Academic Data Collection, fall 2010-Fall 2015 Note: All data prior to Fall 2013 has been combined due to institutional consolidation
Course Success Rates and Grade Distribution for Move on When Ready Students (formerly Dual or Joint Enrolled)
Source: SGSC Banner, Fall 2013-Spring 2015 Source: SGSC Banner, Fall 2013-Spring 2015
Credits Awarded to Move on When Ready (MOWR) Students
|
||||||||||||||||||||||||||||||||||||||||||||||||||||||||||||||||||||||||||||||||||||||||||||||||
|
FY11 |
FY12 |
FY13 |
FY14 |
FY15 |
|
|
Number of Credits Awarded |
1518 |
1441 |
1706 |
2535 |
3808 |
Source: SGSC Banner, FY2011-FY2015
Note: All data prior to Fall 2013 has been combined due to institutional consolidation.
4. Continued SGSC enrollment data on MOWR students after high school graduation reveals that less than half of SGSC’s MOWR students continue at the institution through graduation. However, it is assumed that most MOWR students not remaining at SGSC do go on to graduate from other USG institutions. That assumption needs to be researched.
Enrollment Follow-Up of New MOWR Students Returning as First-Time Freshmen at SGSC (formerly Dual Enrolled and/or Joint Enrolled)
|
Total New Dual Enrolled |
N Returned as First-Time Freshmen |
% Returned as First-Time Freshmen |
|
|
Fall 2013 |
47 |
21 |
44.68% |
|
Spring 2014 |
86 |
40 |
46.51% |
|
Fall 2014 |
123 |
20 |
16.26% |
Source: SGSC Banner, Fall 2013-Fall 2014
Measures of Success
- Numbers of students participating in Move on When Ready
- Move on When Ready course success rates and grade distribution
- Credit awarded to MOWR students
- Continued SGSC enrollment data on Move on When Ready students after high school graduation
|
Strategy #3 |
Near Completers Initiative |
|
Goal |
Increase the number of undergraduate degrees awarded. |
|
High-Impact Strategy |
Piloted in spring 2014 and in full operation summer 2014, the Near Completer strategy identified students who have “stopped out” within 15 semester credit hours of earning an associate degree at SGSC. Staff in SGSC’s Student Success unit contacted such students to schedule an appointment to determine what it will take for them to complete their degree, not simply in terms of courses needed, but also in terms of options to facilitate completion—such as online and independent study courses, legitimate course substitutions, change of program of study, and the like. The goal of the pilot was that at least 30% of those re-enrolled would complete their associate’s degree within one calendar year. The “Near Completers” strategy (strategy #3) is terminated as a college completion strategy as of the conclusion of academic year 2014-2015 for two chief reasons. It has become evident that this strategy is a one-time effort which achieved success in academic year 2014-2015 with a cohort of near completers of 22 students, approximately half of whom re-enrolled and graduated. Subsequent attempts at establishing a second cohort have revealed that any future cohort would consist of so few students that campus resources devoted to the strategy are more effectively tasked with other aspects of recruiting and advising. Also, the creation of the USG’s “Go Back. Move Ahead” initiative is a significant umbrella under which to cover the same kind of effort. SGSC is developing a flagging process in the Office of Admissions to identify students who reapply after two years since last attendance and who are within 15 hours of completion of an associate’s degree. The institution’s goal is to shepherd those students to graduation within one calendar year. |
|
Summary of Activities |
The academic year 2014-2015 near completer strategy continued and produced useful enrollment and graduation data. |
|
Interim Measures of Progress |
Of the 22 students in the cohort beginning spring 2014, 10 (45.45%) have since graduated from SGSC as of the end of spring semester 2015. The target of graduating at least 30% of those re-enrolled within one calendar year of re-enrollment was met. |
|
Measures of Success |
Numbers of re-enrolled students who are retained from semester-to-semester. Original baseline of 10 students re-enrolled spring 2014 and retained to graduation. This strategy is discontinued in favor of Go Back. Move Ahead initiative. Percentage of re-enrolled students who graduate. Original baseline of 45.45% spring 2014. This strategy is discontinued in favor of Go Back. Move Ahead initiative. |
|
Strategy #4 |
“Strategies to Emerge, Progress, and Succeed” (STEPS) |
|||||||||||||||||||||||||||||||||
|
Goal |
Increase the number of undergraduate degrees awarded; provide intrusive advising to keep students on track to graduate. |
|||||||||||||||||||||||||||||||||
|
High-Impact Strategy |
The STEPS initiative began in fall 2012 as a collaboration between Academic Affairs, Academic Support Services, and Residential Life as an effort to increase the persistence and retention of residential students. The student profile of those students who are primarily focused on and monitored is as follows:
|
|||||||||||||||||||||||||||||||||
|
Summary of Activities |
The STEPS strategy involves numerous activities: student success workshops, Academic Success Center tutoring, STEM center tutoring, academic coaching provided by faculty and staff members, course grade monitoring throughout the semester, and individual academic, personal, and disability counseling. A section of SGSC 1000, the first-year-experience course, was formed for first-year residential students meeting the STEPS student criteria and offered in fall 2014. This course was led by a team of instructors from the Division of Student Success, including the Vice President for Student Success, Director of Campus Life, and the Director of Academic Support. In addition, the team of instructors served as academic coaches for the course enrollees. Another cohort of STEPS-eligible students from fall 2013 was selected as a comparator group, since they had participated in non-STEPS sections of the SGSC 1000 first-year experience course, in order to generate data on the apparent effects of the STEPS intervention. Comparative data appear in the table below and indicate that STEPS interventions are very positive. |
|||||||||||||||||||||||||||||||||
|
Interim Measures of Progress |
First Academic Year Metrics for the Fall 2014 STEPS Cohort and Fall 2013 Comparator Group
Source: SGSC Banner as of 11/4/15 Note: Course success rates are defined as the sum of A, B, C, and S divided by the total of A, B, C, D, F, S, U, W, WF. |
|||||||||||||||||||||||||||||||||
|
Measures of Success |
Because the goals and focus of the STEPS program have changed quite significantly since the implementation of the SGSC Complete College Georgia Plan, most measures of success listed below will be assessed after the creation of a data repository to be developed by the SGSC Office of Institutional Effectiveness and the SGSC Academic Student Support Center. Predictive analytics and an early alert system will be implemented. Research necessary to the development of an assessment plan is currently being carried out (fall 2015). Measures of success are as follows:
|
|||||||||||||||||||||||||||||||||
|
Strategy #5 |
Academic Advising |
||||||||||||||||||||||||||||||||||||||||||||||||||||||||||||||||||||||||||||||||||||||||||||||||||||||||||||||||||||||||||||||||||||||||||||||||||||||||||||||||||||||||||||||||||||||||||||||||||||||||||||||||||||||||||||||||||||||||||||||||||||||||||||||||||||||||||||||||||||||||
|
Goal |
Provide intrusive advising to keep students on track to graduate; decrease excess credits on the path to getting a degree. |
||||||||||||||||||||||||||||||||||||||||||||||||||||||||||||||||||||||||||||||||||||||||||||||||||||||||||||||||||||||||||||||||||||||||||||||||||||||||||||||||||||||||||||||||||||||||||||||||||||||||||||||||||||||||||||||||||||||||||||||||||||||||||||||||||||||||||||||||||||||||
|
High-Impact Strategy |
SGSC believes that academic advising can be the single most significant factor contributing to college completion. Academic advising has always been a responsibility of the faculty, and the institution’s college completion agenda calls for enhancing faculty responsibility. It also calls for educating students about academic advising and making use of the DegreeWorks technological tool that can be employed by both faculty advisors and student advisees. However, usable student data related to the consolidation of former South Georgia College and former Waycross College has been problematic for students matriculating prior to fall 2013. The further we move from that term the more functional DegreeWorks has become. Also, prior to the completion agenda, the institution had not assessed academic advising in any fashion. Now there is a very deliberate and ongoing process of both faculty and student training, participating in, and assessing the academic advising process. |
||||||||||||||||||||||||||||||||||||||||||||||||||||||||||||||||||||||||||||||||||||||||||||||||||||||||||||||||||||||||||||||||||||||||||||||||||||||||||||||||||||||||||||||||||||||||||||||||||||||||||||||||||||||||||||||||||||||||||||||||||||||||||||||||||||||||||||||||||||||||
|
Summary of Activities |
|
||||||||||||||||||||||||||||||||||||||||||||||||||||||||||||||||||||||||||||||||||||||||||||||||||||||||||||||||||||||||||||||||||||||||||||||||||||||||||||||||||||||||||||||||||||||||||||||||||||||||||||||||||||||||||||||||||||||||||||||||||||||||||||||||||||||||||||||||||||||||
|
Interim Measures of Progress |
Three separate learning outcomes for student advising were assessed in each semester of the 2014-2015 academic year. In addition, the college tracked the percentage of students enrolling for 15 or more credit hours in each 2014-2015 semester, as well as for the fall semester 2015 as of 06.18.15. Finally, a survey recording opinions on the SGSC advising process was administered to first-time full-time students in the SGSC 1000 first-year experience course, and a survey on the advising process was completed by students from the general SGSC student population and by faculty advisors. Data highlights of all these activities are as follows:
Number and Percentage of Students Enrolling in 15 or More Credit Hours
Source: USG Academic Data Collection, Fall 2011-Fall 2015 Note: All data prior to Fall 2013 has been combined due to institutional consolidation. The table below reports data on student success when enrolling in 15 or more hours: Number and Percentage of Students Successfully Completing 15 or More Credit Hours
Source: SGSC Banner, fall 2013-Spring 2015
Percentage of New FTFT Students Declaring Specific Program of
|
||||||||||||||||||||||||||||||||||||||||||||||||||||||||||||||||||||||||||||||||||||||||||||||||||||||||||||||||||||||||||||||||||||||||||||||||||||||||||||||||||||||||||||||||||||||||||||||||||||||||||||||||||||||||||||||||||||||||||||||||||||||||||||||||||||||||||||||||||||||||
|
N |
% |
|
|
Summer 2013 |
167 |
82.67% |
|
Fall 2013 |
1019 |
97.33% |
|
Spring 2014 |
182 |
95.29% |
|
Summer 2014 |
76 |
83.52% |
|
Fall 2014 |
863 |
97.51% |
|
Spring 2015 |
171 |
100.00% |
|
Summer 2015 |
78 |
100.00% |
Source: SGSC Banner, summer 2013-Summer 2015. Note: All data prior to fall 2013has been combined due to institutional consolidation.
One of the goals of the SGSC completion plan directly related to the importance of academic advising is to reduce the number of excess credit hours students earn on their path to graduation. The baseline for capturing data related to this effort is established as FY 14, the first year of the consolidated institution’s curriculum and course offerings. The table below identifies the baseline numbers for each of the college’s academic programs.
Average Credit Hours Earned at Graduation by Degree Conferred
|
FY11 |
FY12 |
FY13 |
FY14 |
FY15 |
|
|
Associate of Arts core curriculum |
|||||
|
Overall Credit Hours Earned |
72.00 |
71.75 |
73.61 |
72.41 |
71.87 |
|
Institutional Hours Earned |
67.00 |
65.87 |
65.66 |
64.45 |
66.65 |
|
Transfer Hours Earned |
20.03 |
17.79 |
16.85 |
19.79 |
13.47 |
|
Associate of Science core curriculum |
|||||
|
Overall Credit Hours Earned |
73.77 |
74.96 |
73.71 |
73.44 |
75.29 |
|
Institutional Hours Earned |
68.50 |
68.87 |
68.07 |
69.78 |
69.18 |
|
Transfer Hours Earned |
16.40 |
17.80 |
18.01 |
15.24 |
20.08 |
|
AS in Nursing |
|||||
|
Overall Credit Hours Earned |
95.34 |
91.18 |
96.01 |
95.99 |
97.98 |
|
Institutional Hours Earned |
74.55 |
79.59 |
82.09 |
80.15 |
83.73 |
|
Transfer Hours Earned |
46.34 |
29.57 |
32.46 |
40.22 |
32.19 |
|
BS in Nursing |
|||||
|
Overall Credit Hours Earned |
- |
- |
- |
150.97 |
145.30 |
|
Institutional Hours Earned |
- |
- |
- |
135.12 |
131.83 |
|
Transfer Hours Earned |
- |
- |
- |
27.17 |
20.20 |
|
BS in Biological Sciences |
|||||
|
Overall Credit Hours Earned |
|||||
|
Institutional Hours Earned |
|||||
|
Transfer Hours Earned |
|||||
Source: SGSC Banner
Note: (1) Duplicate graduates were removed from the averages. (2) BS Biological Sciences program began in Fall 2014 and students are expected to graduate in Spring 2016.
Because effective academic advising is so crucial to college completion, several of the most important completion metrics are reported here. The following data tables focus on one-year retention rates, percentage of credit hours successfully completed, and degrees conferred. The data shows that, while not much time has transpired since the fall 2013 initial semester of institutional consolidation, the trend for all metrics has been positive.
SGSC First-Time Full-Time Degree-Seeking Freshmen One-Year Retention Rates
|
Institutional Rate for SGSC |
System-Wide Rate for SGSC |
||||
|
# Cohort |
# Retained |
% Retained |
# Retained |
% Retained |
|
|
Fall 2009 |
1010 |
497 |
49.21% |
615 |
60.89% |
|
Fall 2010 |
1088 |
509 |
46.78% |
613 |
56.34% |
|
Fall 2011 |
1131 |
582 |
51.46% |
688 |
60.83% |
|
Fall 2012 |
965 |
465 |
48.19% |
590 |
61.14% |
|
Fall 2013 |
878 |
427 |
48.63% |
563 |
64.12% |
Source: USG Retention Report, fall 2009-Fall 2013. Fall 2013 is the most recent data available from the USG.
Note: All data prior to Fall 2013 has been combined due to institutional consolidation.
Note: Retention rates are defined as the percentages of students in a given cohort who are enrolled in a USG institution in a specified term (in this case, one year later) or are not enrolled in the specified term but have graduated from a USG institution between matriculation and that term. The number of students in the cohort is the denominator of the rate; the number of students enrolled or graduated but not enrolled one year later is the numerator of the rate. The one-year institution-specific retention rates for South Georgia State College are the sum of the first-time full-time freshmen retained at SGSC divided by the total SGSC first-time full-time freshmen cohort. The one-year system-wide retention rates for South Georgia State College are the sum of the first-time full-time freshmen retained at SGSC or with the University system of Georgia divided by the total SGSC first-time full-time freshmen cohort.
Percentage of Credit Hours Successfully Completed –All Students
|
Hours Earned |
Hours Attempted |
% Successfully Completed |
|
|
Fall 2011 |
25433 |
35187 |
72.28% |
|
Fall 2012 |
25220 |
34504 |
73.09% |
|
Fall 2013 |
22236 |
30073 |
73.94% |
|
Fall 2014 |
23003 |
30331 |
75.84% |
Source: SGSC Banner, fall 2011-Fall 2014
Note: All data prior to Fall 2013 has been combined due to institutional consolidation.
South Georgia State College Degrees Conferred by Degree Offered
|
FY 2011 |
FY 2012 |
FY 2013 |
FY 2014 |
FY 2015 |
|
|
Associate of Arts/Science |
272 |
269 |
262 |
178 |
239 |
|
Associate of Nursing |
84 |
74 |
63 |
66 |
70 |
|
Bachelors |
0 |
0 |
0 |
22 |
33 |
|
Total |
356 |
343 |
325 |
266 |
342 |
Source: USG Degrees Conferred Report, FY2011-FY2015
Note: All data prior to Fall 2013 has been combined due to institutional consolidation
Measures of Success
|
Metric |
Baseline |
Goal |
|
Enrolling in 15 credit hours |
Fall 2013-21.33% |
Increase by 2% each year |
|
Completing 15 credit hours |
Fall 2013-46.99% |
|
|
Retention Rates for First-Time Full-Time Freshmen |
Fall 2013-48.63% |
|
|
Graduation Rates for First-Time Full-Time Freshmen |
Fall 2011-9.99% |
|
|
Percentage of credit hours successfully completed |
Fall 2013-73.94% |
Note: fall 2013 was the first semester of consolidated institution curriculum and course offerings.
General Observations
- Gathering data on the strategies of the institutional College Completion Plan has been extremely fruitful, not only in terms of assessing completion strategies, but also in terms of analyzing overall institutional effectiveness. There are clear strategic “successes” and equally clear opportunities for improvement.
- Implementation of the institution’s College Completion Plan has underscored the importance of effective academic advising as probably the chief contributor to student success, persistence, retention, and graduation.
- With the matriculation of the first and subsequent Bachelor of Science in Nursing degree students beginning in 2013 and the matriculation of the first cohort of Bachelor of Science in Biological Sciences students in fall 2014, SGSC is offering two new bachelor’s degree programs that will help produce more college degrees.
- South Georgia State College has been a leader in the creation of academic program maps to guide students on a pathway to success and graduation. In fact, as part of the USG’s “Guided Pathways” program USG Assistant Vice Chancellor for Transitional and General Education Dr. Barbara Brown selected SGSC as a “vanguard” institution for Guided Pathways to Success,” citing the institution’s “beautifully organized program maps for all of its degree programs.” In addition, Dr. Brown invited a team of SGSC leaders to participate in a Guided Pathways to Success Policy Institute in Atlanta in June 2014 and a GPS Academy in September 2014.
- SGSC was also singled out by the USG for its efforts with “15 to Finish,” focused on maximizing student course loads each semester. From fall 2012 to fall 2014 SGSC had more than double the state college sector average of students enrolled in 15 or more hours. Quoting Dr. Barbara Brown again, “South Georgia State College was at the top of the state college sector in percentage of students taking 15 or more credits in fall 2014.”
- One challenge to SGSC’s college completion efforts is the institution’s need for additional technology personnel to support the generation of data needed to assess and inform completion strategies, particularly as SGSC continues to develop a predictive analytics effort based on the Georgia State University model.
- It would be helpful to the college completion agenda if the USG were to resume providing to institutions student transfer data within the System to facilitate tracking student progress toward a degree. Another significant transfer student data resource that might be resumed is grade point average data at receiving institutions.
- It would be helpful for the USG to provide “official” institutional retention and graduation rate data in a timelier manner.